Crossing the data chasm
We are generating more data than ever before. Today, best estimates suggest that a staggering 2.5 quintillion bytes are produced every day. But there is a gap between the data generation and the value created from that data. It is this gap that we call the ‘data chasm’ and it’s a chasm that must be crossed for future digital transformation to be realised.
An Accenture study across 190 executives in the United States found that only 32% of companies reported being able to realise tangible and measurable value from data and only 27% said that analytics projects produce insights and recommendations that are highly actionable.
In that report, Ajay Visal, Data Business Group Strategy Lead, Accenture Technology said: “Companies are struggling to close the gap between the value that data makes possible and the value that their existing structures capture—an ever-expanding chasm we call ‘trapped value’.” The World Economic Forum estimates that we could secure around $100 Trillion of incremental gross domestic product (GDP) growth if we could fully unlock the value of this data.
What is the cause of this 'trapped value'?
For insights to be generated, first, data must be organised into datasets. Datasets are rows and columns (similar to an excel spreadsheet) organising the data into groups and categories. Once this has been done, the data can be analysed. Insights are generally derived from multiple data points in a certain sequence to indicate something. Typically, this involves code being developed to ‘query’ the data in a particular way, looking at particular rows and columns in combination.
The sheer volume of data that we are generating today makes this challenge difficult and time-consuming. But it’s not just time. People need to know what to look for before they start this process, meaning they must be highly confident of the questions they want to ask of the data before they start. Given insights often lead to questions, there is a cap on the value that one can realise from data following traditional methodologies.
What’s more, the value of an operational insight deteriorates over time. If the insight that something is going to be delayed is provided hours after the shipment eventually arrives, it’s useless. So, to provide real value, these insights need to be generated in real-time.
Implementing the flexibility needed to cope with new data, being able to change the questions you are asking of the data and ensuring insights are captured in real-time are difficult obstacles to overcome. But they are critical to unlocking the ‘trapped value’ we speak of.
A perpetuating problem.
One of the business contributors of data generation in recent years, and a source that is expected to increase data generation exponentially, is the increasing adoption of Internet of Things (IoT) systems and hardware. As the graph illustrates below, the projected increases in data generation track almost exactly to the IoT deployment projections.
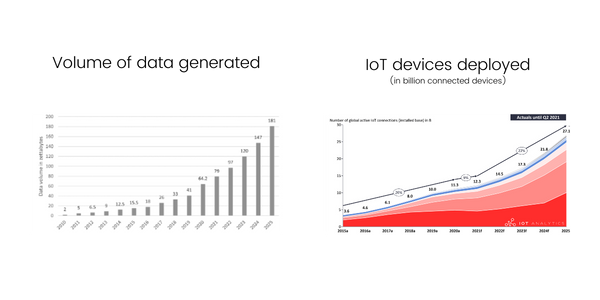
IoT sensors provide real-time data for things. This could be the location of an asset, the temperature of a fridge, etc. IoT offers enormous potential to use data to improve operations, businesses, processes, experiences, etc. But it also adds to the problems already described in this article.
Firstly, it offers a means of much higher velocity data (near real-time). This velocity makes it harder to find insights retrospectively (and order of magnitude more data to sift through). Secondly, IoT data is less structured (referred to as unstructured/semi-structured data). Unlike the data from typical back-office systems that are nicely formatted, IoT data is communicated in the form of JSON packets and images. And finally, IoT data is more volatile. Unlike systems transferring data from cloud to cloud, IoT devices communicate over the air using cellular, and Bluetooth and are more prone to loss/corruption (due to communications protocols, etc.).
Technologies like data warehouses simply can’t cope with the velocity, volatility, and unstructured nature of IoT data. To this end, data lakes emerged as the new go-to technology for big data projects. Data lakes are specifically designed to cope with these types of challenges, capable of handling high volumes of structured, unstructured, and semi-structured data at high velocity.
Many businesses deployed a data lake in one form or another – to centralise the huge volumes of data they were generating, critically including IoT data. However, most were still unable to garner the actionable insights they deserted, or at least had to exert enormous additional effort and development work to do so. This is because just putting all the data in one place doesn’t provide the structure needed to be able to analyse the data properly. The challenges of organising and structuring the data do not get any easier. The ability to access data is made easier, but the ability to use that data is not.
Silver bullet technologies.
With these problems still prominent, some technologies have emerged as potential ‘silver bullets’. Artificial intelligence, for example, has been pitched as a tool that can scan huge volumes of data (such as that of a data lake) and find those hidden insights. But of course, these technologies most often fail or at least, only generate moderate insights that have limited business impact.
Other technologies such as blockchain have been presented as a means of solving many of today’s challenges with data. But again, they have fallen short, with many large organisations not yet claiming to gain tangible value from their data.
None of these emerging technologies provides a solution to organising the huge volumes of data in a way that provides the flexibility, agility, and real-time nature needed to deliver the transformative insights businesses need to realise tangible value from their data. Technologies like Artificial Intelligence and blockchain provide tools to take data to new levels. But to unlock them, and start realising tangible value from data, there is a step before – a step that requires a totally new approach to data.
Looking at data through the lens of the entity.
If we are to cross the data chasm, a completely new approach is needed. Instead of looking at data in a linear way, and thinking about it as data, we need to change our perspective. We need to start looking at data through the lens of the entity.
But what does this mean? Today, we typically think about data as bits and bytes, in rows and columns, as datasets. But when we, as human beings look at the world, we don’t see data, we see things described by data. We don’t see things like age, height, and weight as individual things. We see a person that has a particular age, height, and weight. This may sound obvious, but it’s a critical perspective in crossing the data chasm.
By looking at the data through the lens of the entity, each datum belongs to some ‘thing’. It is attributed. By treating data in this way, you create a natural framework that can organise data in real-time, at a highly granular level. But it goes further…
In the real world, things have relationships with other things. A person has a relationship with another, mother, father, son, or daughter; a person has a relationship with a house; a house with a street; a street with a city. Within relationships, ‘things’ have defined roles and functions. A house is the home of a person. Or one person is the father of another. Of course, the relationships can change over time, but whilst they exist, they create links between real-world things, and critically, they create meaning. It is this meaning that helps to uncover insights hidden in large datasets in real time.
How can this be achieved through software?
What we are essentially describing is a digital twin – a virtual representation of a real world process or system for the duration of its lifecycle, that serves as a digital counterpart to aid simulation, monitoring, testing, and maintenance. The use of digital twins is rising across all industries, with notable interest in sectors like supply chain and healthcare.
Digital twins create a framework through which data can be looked at through the lens of the entity. Instead of individual rows of data, you have objects that have dynamic relationships with other objects. The digital framework enables data to be structured in this way and helps to overcome some of the key challenges outlined in previous paragraphs.
What’s more, the digital twin is established irrespective of the question. Think about it, it’s just a virtual representation of the real-world. Once established, questions can be asked of the digital twin. This sort of flips the previous notion of the analysis process. Rather than coming up with the question first and then organising the data, the data is organised and then the questions are asked. This provides huge flexibility with regard to what questions one can ask of the data.
Ontology & digital twin.
‘Ontology’ is a central concept when considering digital twins. A term that has been somewhat hijacked by the data community originated in metaphysics – a branch dealing with the ‘nature of being’. In data, it means ‘a set of concepts and categories in a subject area or domain that shows their properties and the relations between them’. But in essence, it is all about giving the data meaning.
Ontology is the science that sits behind the digital twin. It is the way that data is structured and organised in a way that allows true reflection of the real world, delivering true meaning from data. It is somewhat of an emerging concept and there are many variations and interpretations, but if delivered correctly, it is enormously powerful.
The concept of a semantic data foundation.
Once established, a digital twin creates a semantic data foundation. An operational data layer that sits above data sources (existing infrastructure) and future data services (specific applications asking specific questions). Such a concept enables highly complex, multidimensional insights to be generated, it facilitates the asking of new questions without having to rework or rewrite code and it provides a framework that scales as new data is surfaced.
The key to crossing the data chasm is to look at data through the lens of the entity. The way to do this is to create a semantic data foundation otherwise known as a digital twin.
In summary.
In summary, the key to crossing the data chasm is not a silver bullet technology but instead, a way of looking at data. It’s a perspective shift, from looking at data in tables to looking at data as attributes of things.
Businesses that can successfully make this shift and adopt software that enables them to do so, will realise tangible value from their data, gaining significant competitive advantage and accelerating ahead of their competitors.